Go to Japanese page | Return to a main page
5/30/2005 by Shigeyuki Seko
|
The following is the model which checked operation of IRMonitor at this time.
SONY CLIE : PEG-N750C / T600C / TG50 / SJ33 / NX60 / NX70V / NX80V / UX50 / TH55
Palm IIIx / Palm Vx / c505 / Visor Platinum /
TUNGSTEN C / TUNGSTEN T5 / TUNGSTEN T3 / Zire 31 / Zire 72
Zodiac<Notice>
This IR Monitor is using Raw IR mode of PalmOS.
Raw IR mode cannot be used on OMAP-based
(Tungsten|T, Tungsten|T2, Tungsten|E, Zire21, Treo600, and Zire71)
products due to an OMAP processor limitation.
The OMAP's UART3 automatically frames all data according to the IrDA specification.
There is no way to change this setting in the processor and use raw IR in the OMAP UART.
Therefore, IRMonitor cannot be used by the model of OMAP.
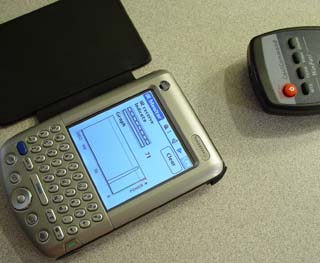
This program neme is IrMonitor. Please select ICON of IrMonitor.
It is a screen at the time of program starting.
IR Monitor starts the measurement of the amount of IR simultaneously with starting.
- IR receive Indicate
The bar graphical representation of the received amount of infrared signs is carried out on real time.- Graph
Transit of the amount of infrared signs over 130 seconds is displayed on a line graph.Menu
- About ------ The information about this program is displayed.
Icon
The functional icon of a screen upside is explained.
Each icon can express the present condition and can change the mode by carrying out the tap of these icons.The magnification of the vertical line
The magnification of the vertical line of a graph is x1.
The magnification of the vertical line of a graph is x10.Sound ON/OFF
Sound ON
Sound OFF
Change Graph mode, Start or Stop.
Graph Start
Graph Stop
Graph erasure.
All data and graphs are cleared.
It is an indicator showing infrared strength.
Upside meter expresses the strength of momentary infrared radiation, and lower meter expresses the total quantity of the IR after starting a observation.
Normal graph mode.
An horizontal direction expresses time and a vertical direction expresses infrared strength.
Integral graph mode.
An horizontal direction expresses time and a vertical direction expresses the quantity of the amount of infrared radiation from measurement beginning.
Copyright (C) 1998-2005 by Shigeyuki Seko all right reserved.
THIS SOFTWARE IS ``AS IS'' AND NO WARRANTY.